Detailed data analysis and modern business intelligence (BI) tools help CMOs create proactive strategies that drive sales and guide customers through the sales funnel quickly and painlessly.
Many of the most knowledgeable Chief Marketing Officers use Power BI marketing dashboards to manage it all. This cloud-based visualization tool takes complex sets of marketing and customer data and distills them into insightful graphics for use in report generation and strategizing.
But is this really the best tool for CMOs, or are there better options? Let’s look at all of the pros and cons.
What is a Power BI Marketing Dashboard?
Microsoft’s Power BI is a system of visual aids and data analysis tools that users can generate and view in the cloud. What makes this such a compelling tool for CMOs is that it’s very customizable and open-ended. CMOs have access to an enormous gallery of visual templates, many of which are designed specifically for tracking marketing strategies, customer behavior, and sales. All the CMO has to do is upload the organization’s data into the system and select the visual aids they find most useful.
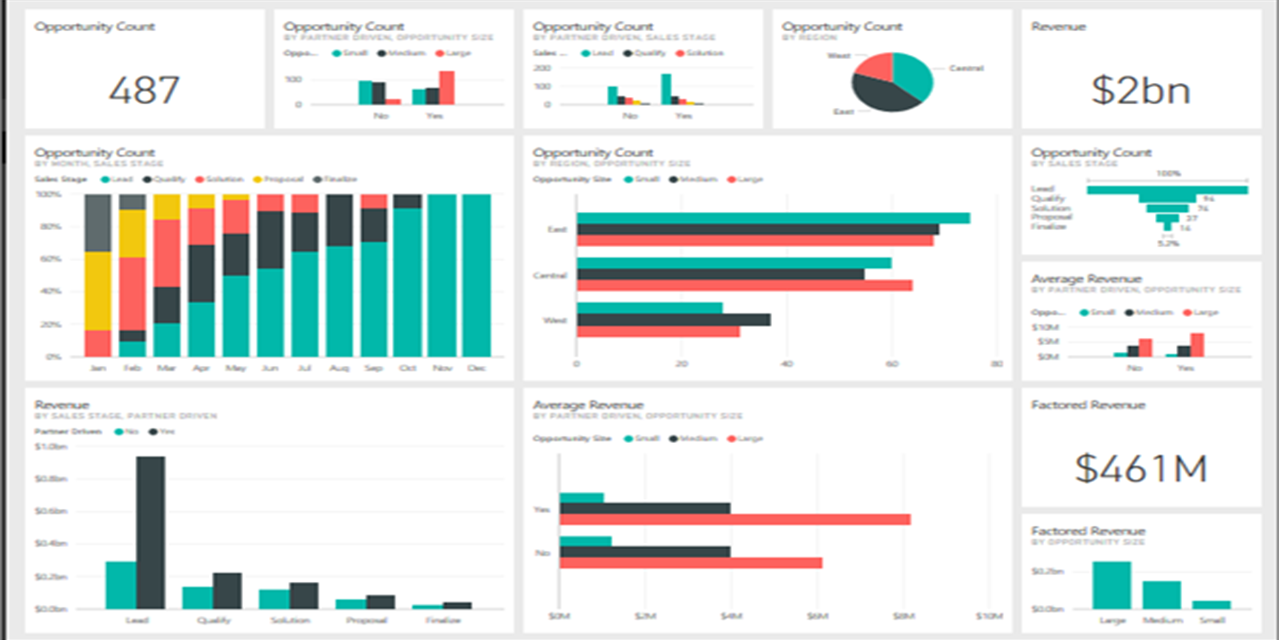
A Power BI marketing dashboard takes this process to the next level. It lets CMOs generate multiple visuals on a single page so that they can view their entire marketing strategy at a glance.
In Power BI, you can choose to either generate one visual or report at a time, or to build your own custom dashboard that includes multiple graphics and data filters. The look and function of Power BI marketing dashboards varies based on personal preference. Some CMOs may need separate dashboards for digital marketing vs. other channels, as the metrics the visuals display are very different.
However, to make and use a Power BI marketing dashboard, CMOs first need to be familiar with the Power BI system and also must learn how to design these dashboards so that they display every visual properly.
How to Build a Power BI Marketing Dashboard
To create a customizable Power BI marketing dashboard, CMOs need a Power BI Pro or Premium license. This lets create new dashboards and share them with others in the organization. Another benefit of having a Pro or Premium license is that CMOs can upload more data to the system, meaning their visuals will be more detailed and accurate.
After signing up for Power BI, CMOs can then follow these steps to set up their own Power BI marketing dashboard:
- Give Power BI permission to access and upload the organization’s data.
- Generate reports for each data set and publish the reports to the Power BI platform.
- Select the Dashboard option from the Power BI homepage and create a new dashboard.
- Go back to the homepage and click on Reports and then Edit Report.
- Generate marketing visuals based on the data in the report; you can select these from the visual gallery and customize them to fit your needs.
- After the visual is complete, hover over the visual and select the Add to Dashboard option (the thumbtack icon).
- Go back to the dashboard editor and move the visuals around the page as needed.
- Publish and share the dashboard with your peers or use it to come up with new marketing strategies.
Which visuals should the CMO include in the dashboard? It depends on the CMO’s needs at any given time. Some possibilities:
- Overall marketing strategy: A simple flowchart will show what you plan on doing to improve the organization’s marketing strategy moving forward. You can also use Gannt charts to track your progress and document important milestones.
- Sales funnels: Use visual aids to show how your customers move through the sales funnel and identify areas that need improvement.
- Target market and demographics: Generate pie charts and other visuals that identify who your target audience is and whether you should start targeting other customers.
- Industry shares and competitor comparisons: Analyze how the organization is performing vs. its competitors using detailed comparison visuals. You can then use this information to either improve your marketing strategy or advertise your organization’s advantages over competitors.
- Marketing channels and advertising: Use charts and other visual aids to determine which advertising channels have the best results so you can focus on spending time and resources on the most successful strategies.
- Budget: Analyze your marketing budget from multiple perspectives using Power BI’s many budget tracking visuals.
With so many options, a Power BI marketing dashboard is a dynamic and valuable tool for CMOs. However, there are also a few downsides to using Power BI to create marketing strategies, so keep this in mind before you rely too heavily on the system.
Are Power BI Marketing Dashboards the Best Tool for CMOs?
A Power BI marketing dashboard is designed for CMOs who already know which metrics they want to track and which visual aids will best display these metrics. Ideally, the CMO will also be familiar with how to build a dashboard in Power BI and arrange the graphics in a way that is both visually compelling and informative.
The main problem with Power BI marketing dashboards is that they are too open-ended for some users. Many CMOs don’t have graphic design or data science backgrounds, so they may be unsure of exactly which visuals to include in the dashboard and how to arrange them in a way that makes the most sense.
Another limitation of a Power BI marketing dashboard is that it’s not capable of performing very detailed data analysis or handling large sets of data. If a CMO wanted to assess the risk of a proposed promotional sale, Power BI’s visuals aren’t the best tools for this type of risk modeling. The CMO would need a system that also uses machine learning to generate predictive models and translate them into visual form.
The Dashboard CMOs Should Use Instead
One alternative to Power BI marketing dashboards is a custom dashboard built by data scientists with experience in data analysis for marketing, including predictive modeling. Unlike a Power BI dashboard, which can only display the visuals offered in the Power BI gallery, a custom dashboard can include Power BI visuals as well as visuals from other tools like Tableau. A data analytics firm will also integrate machine learning algorithms into the system so that CMOs can accurately predict the outcome of various marketing campaigns.
Data scientists help you migrate to a cloud storage system for all of your data as well, so that the custom dashboard can access everything—the custom dashboard can process far more data than Power BI. This means that your marketing strategy will be based on the entire picture, not just a slice of it.
By hiring a data analytics firm to build a custom dashboard of visuals and other marketing aids, organizations can provide the marketing team with the innovative tools they need to grow the company’s share of the industry. CMOs will find the perfect strategy to capture customer attention and strengthen the company’s brand.
If you’re a CMO looking for a powerful way to create forward-thinking strategies, contact Tek Leaders today. Our team of data scientists will ask about your workflow and goals, then design a custom dashboard you can use to generate visuals and keep your team on track. If you’re curious about how a Power BI dashboard compares to our customized dashboards, you can reach us by email directly.
Devender (Dev) Aerrabolu